• Case Study

GPU Dashboard

GPU monitoring dashboards contain critical performance data, but they often require high effort to interpret quickly. In this project, I redesigned a Grafana-style GPU cluster monitoring dashboard into a clearer, more decision-oriented interface.

The goal was to improve scanability and usability while preserving all essential metrics, enabling users to move faster from detection to diagnosis.

Client

TensorWave

Industry

AI Infrastracture

My Role

Product Designer

Date

January 2026

The Problem

The original dashboard surfaced a large number of GPU and node metrics, but it lacked a strong hierarchy. Important signals were visually competing with secondary data, making it harder to answer common operational questions quickly.

Users monitoring GPU clusters typically need to:

  • Detect performance issues early
  • Understand resource utilization and bottlenecks
  • Identify abnormal GPU behavior
  • Investigate trends over time without losing context
  • The current, messy dashboard

My Approach

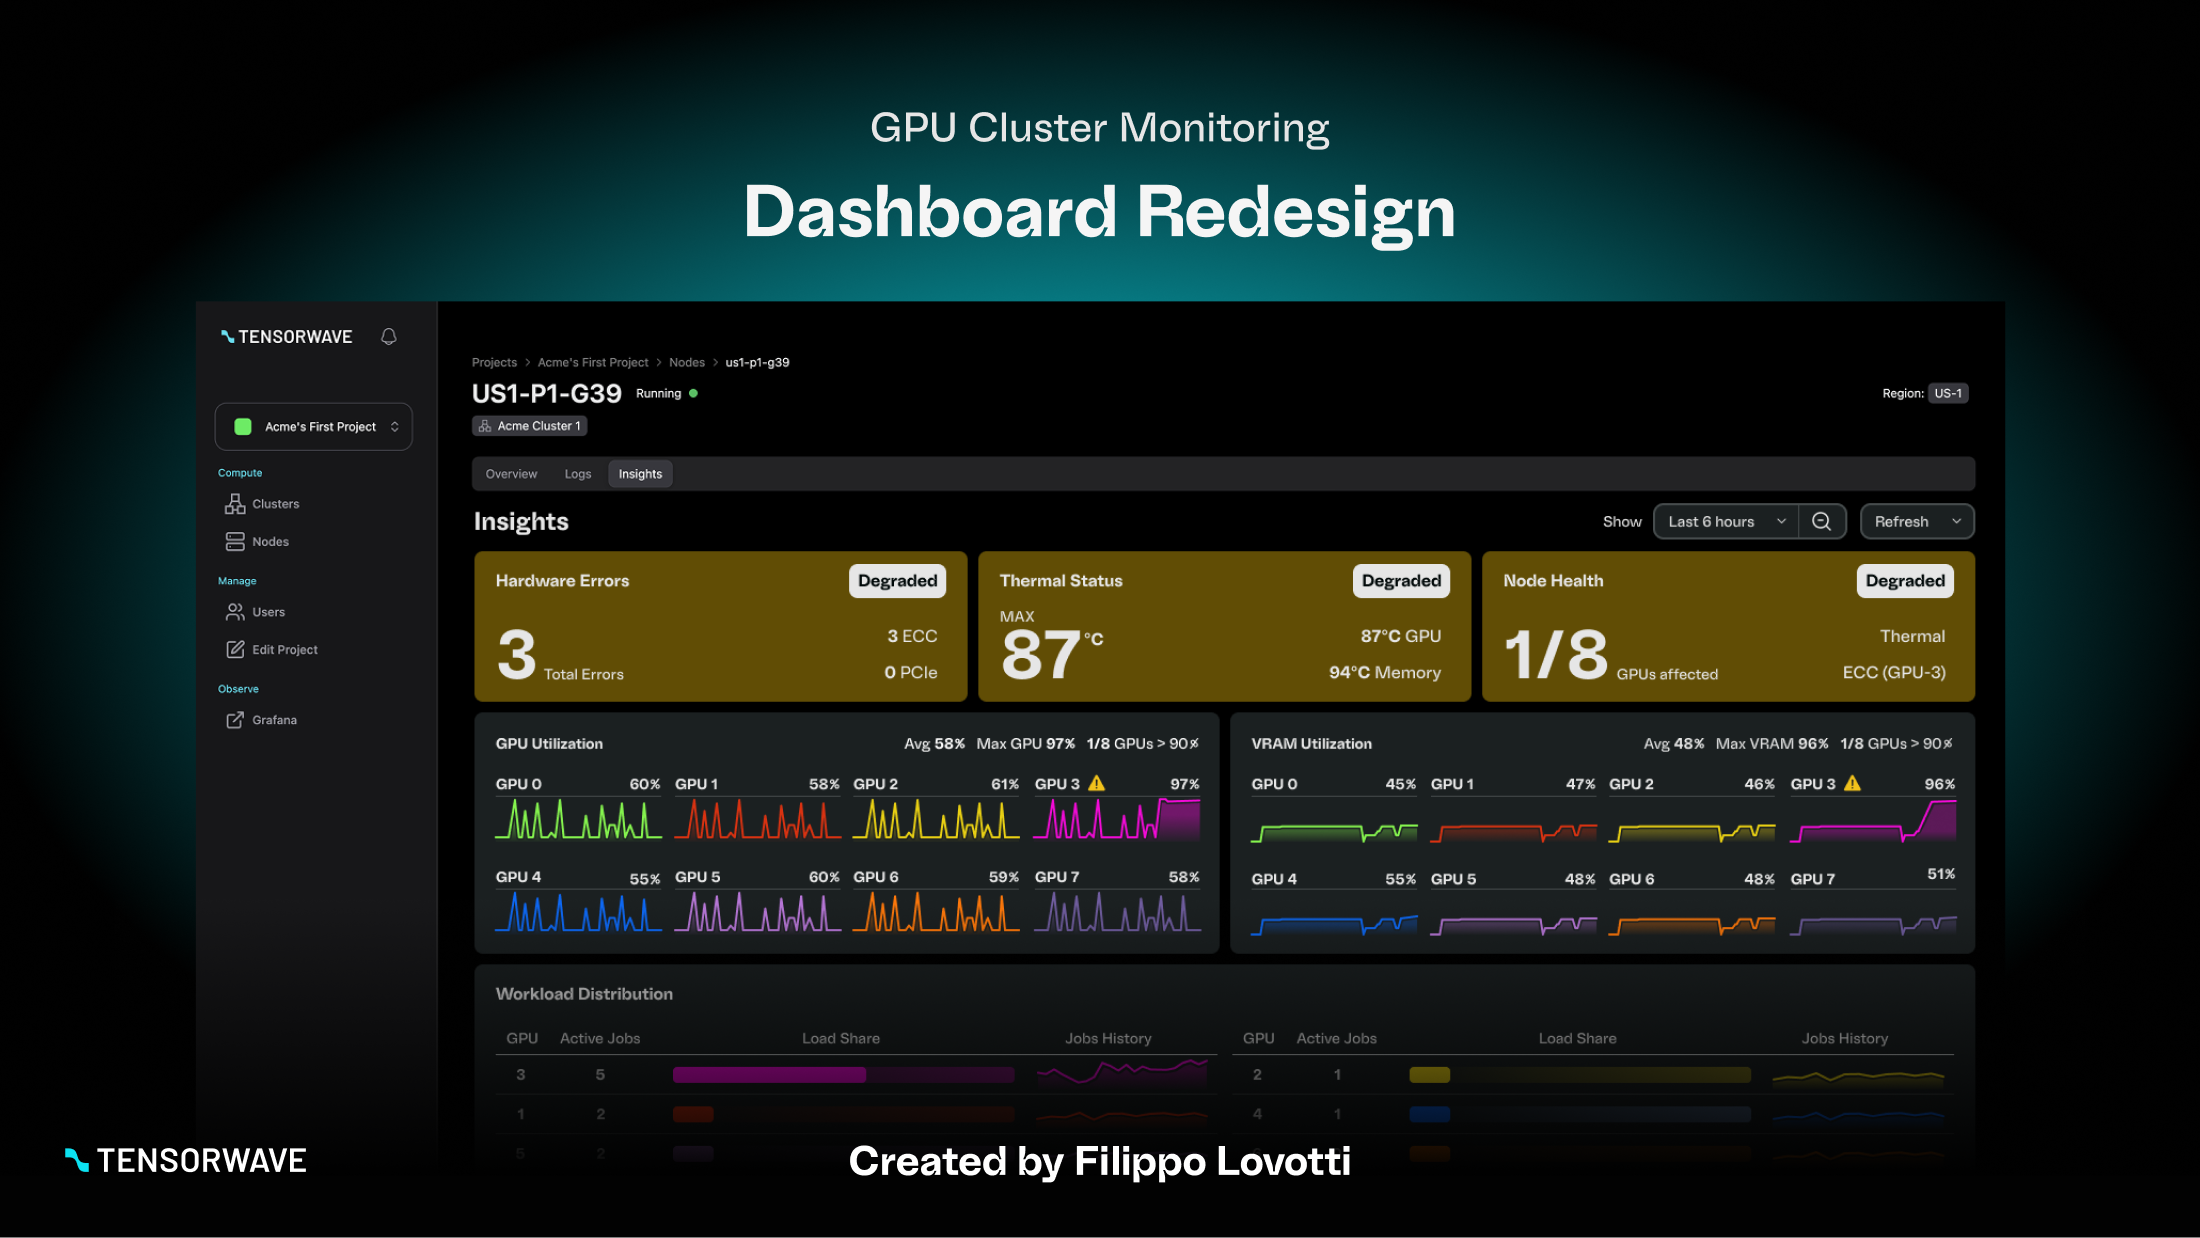
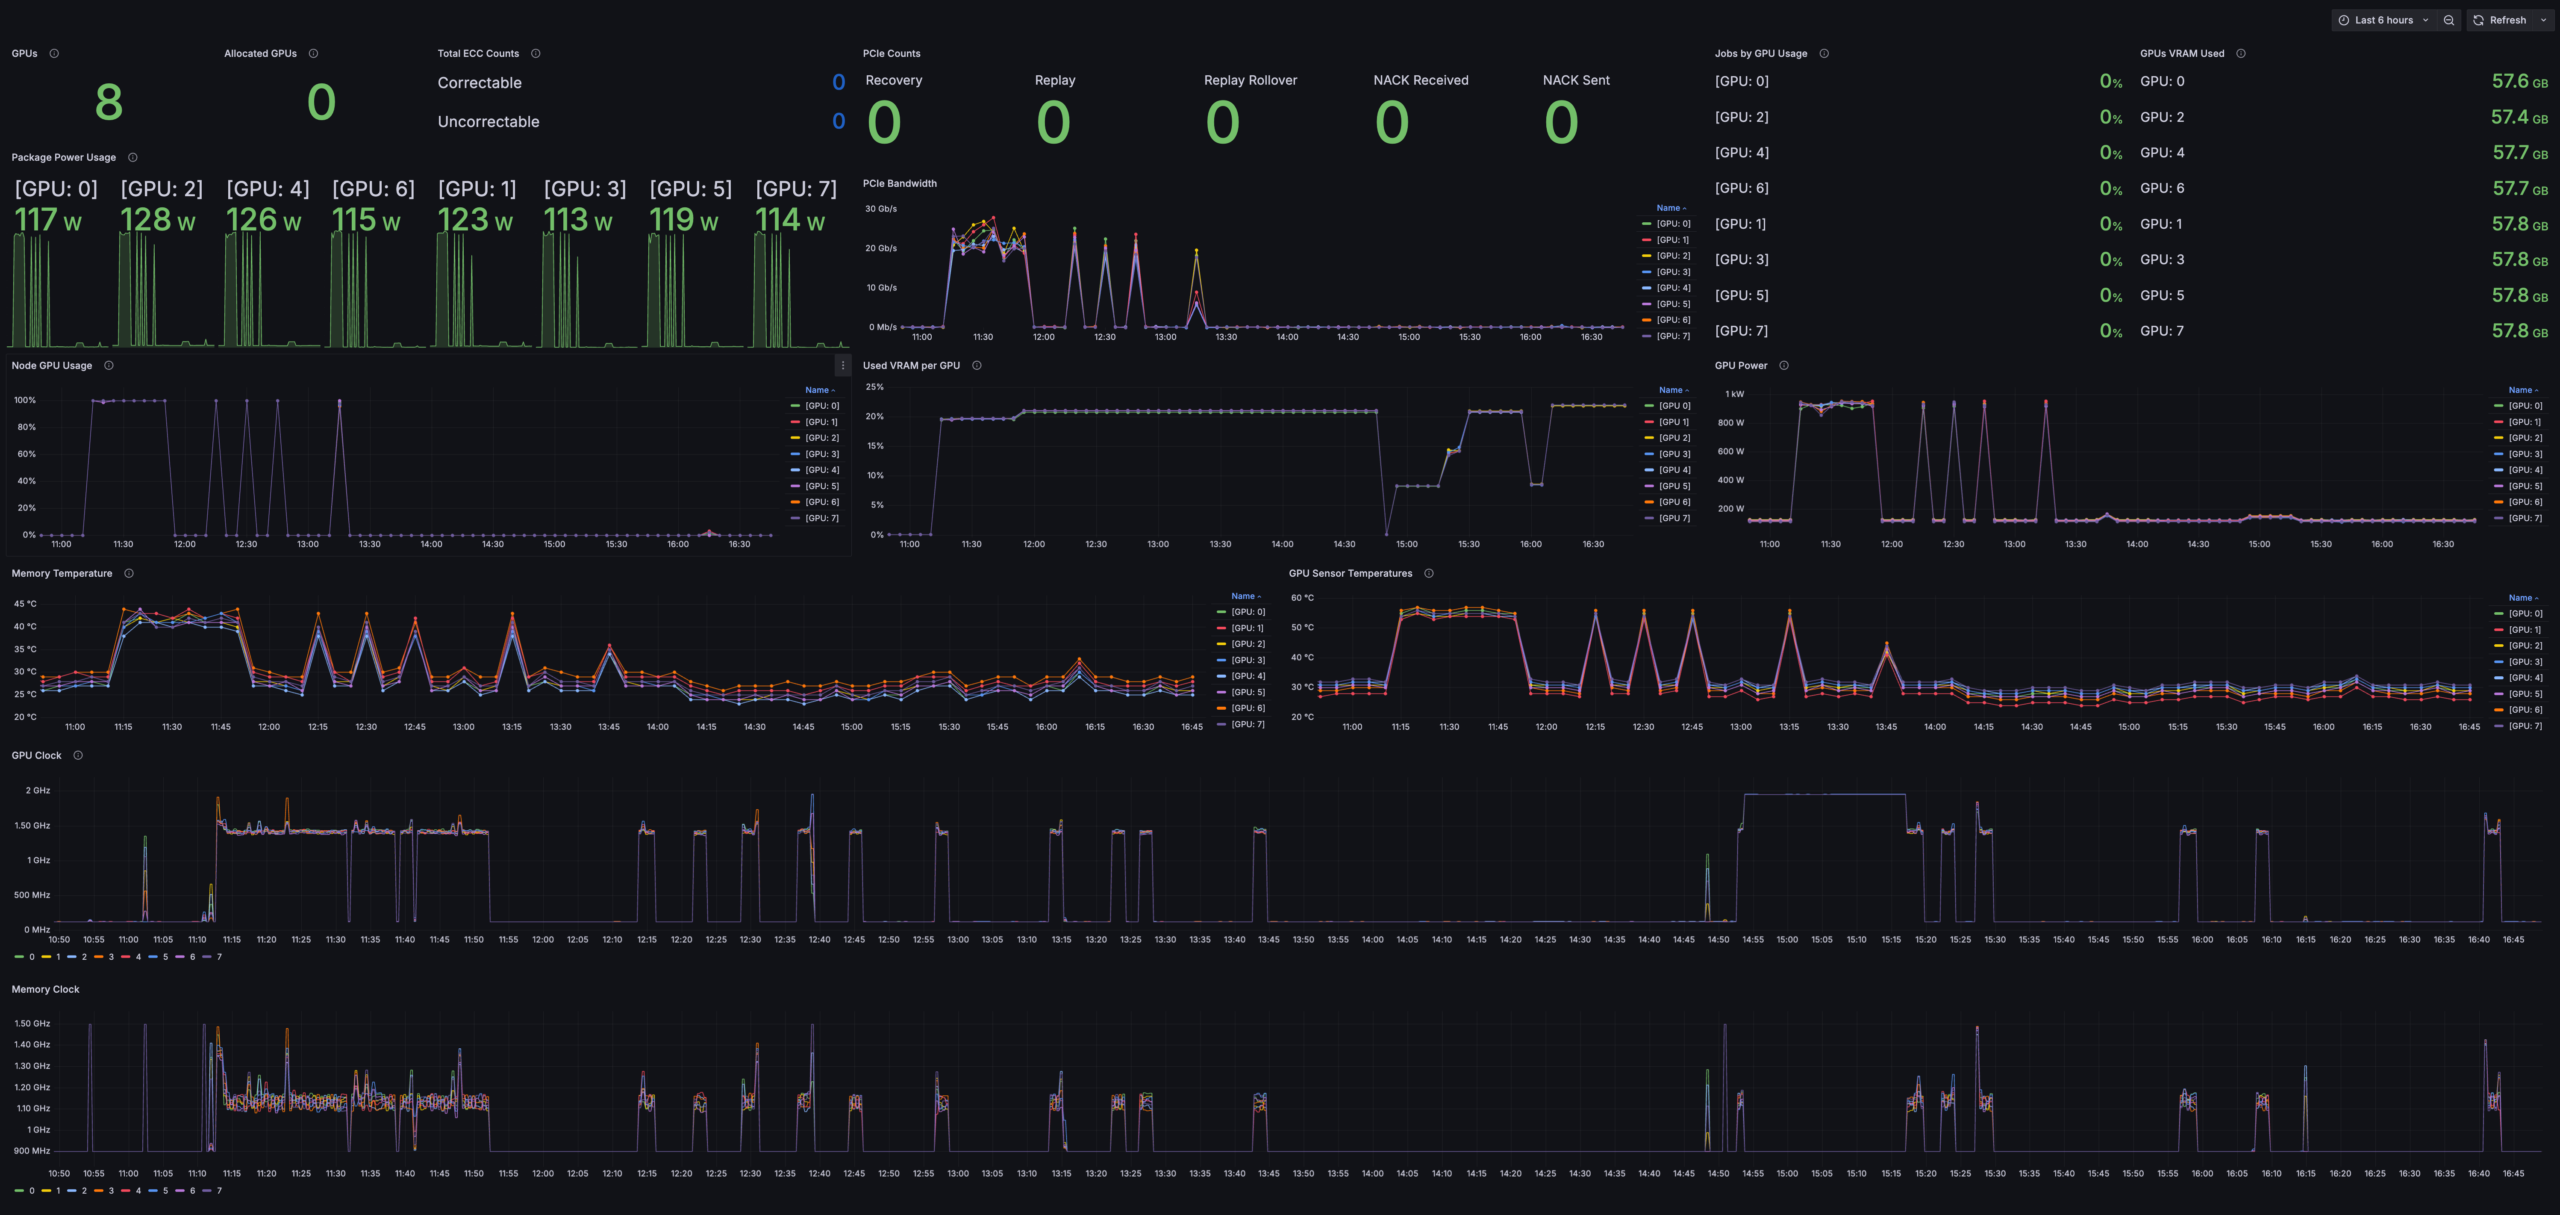
I treated this as an operational decision-making interface, not a “chart cleanup” exercise. My focus was to preserve critical data while reorganizing the experience around the questions users are trying to answer in real time.

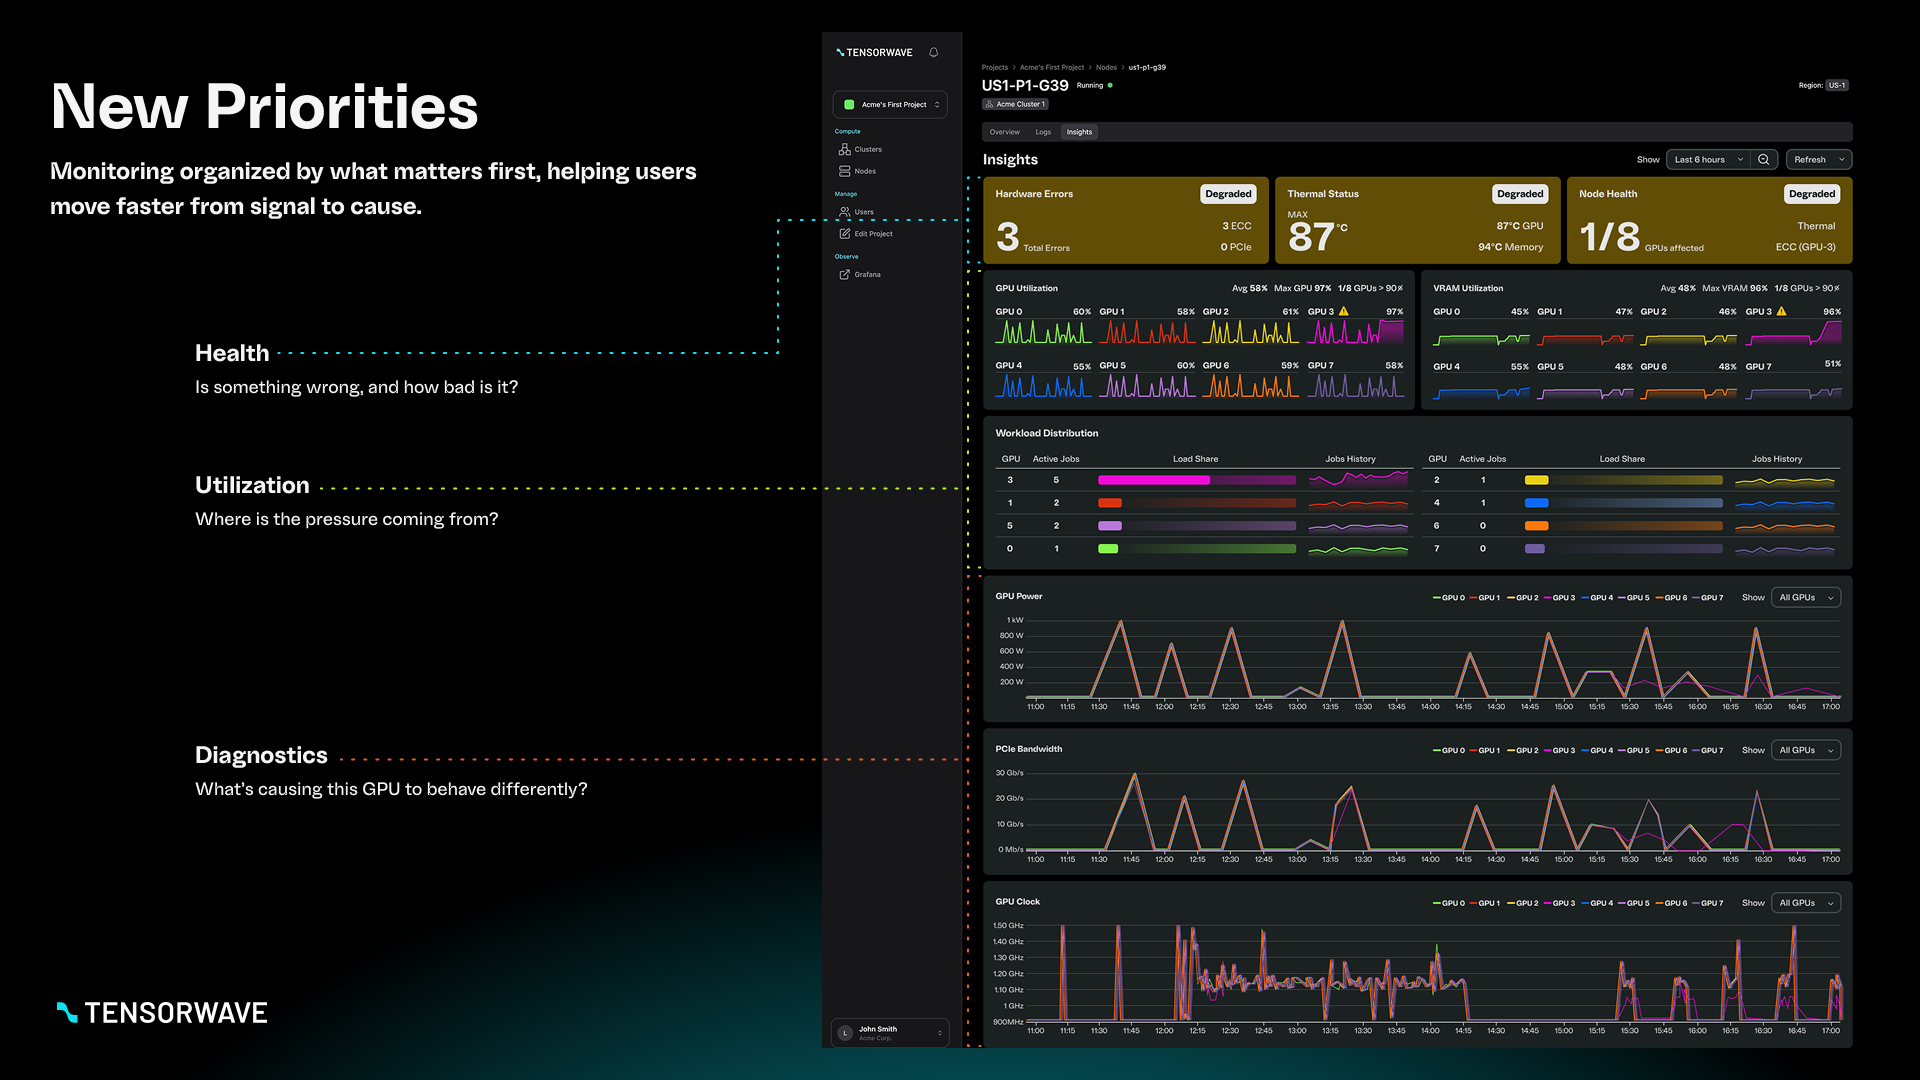
1) Information hierarchy

I reorganized the dashboard into three clear layers:

  • Health: Are there any issues requiring attention right now?
  • Utilization: Where is capacity being consumed or constrained?
  • Diagnostics: What’s causing abnormal behavior and where is it happening?

This structure makes the dashboard faster to scan while still supporting deeper investigation.

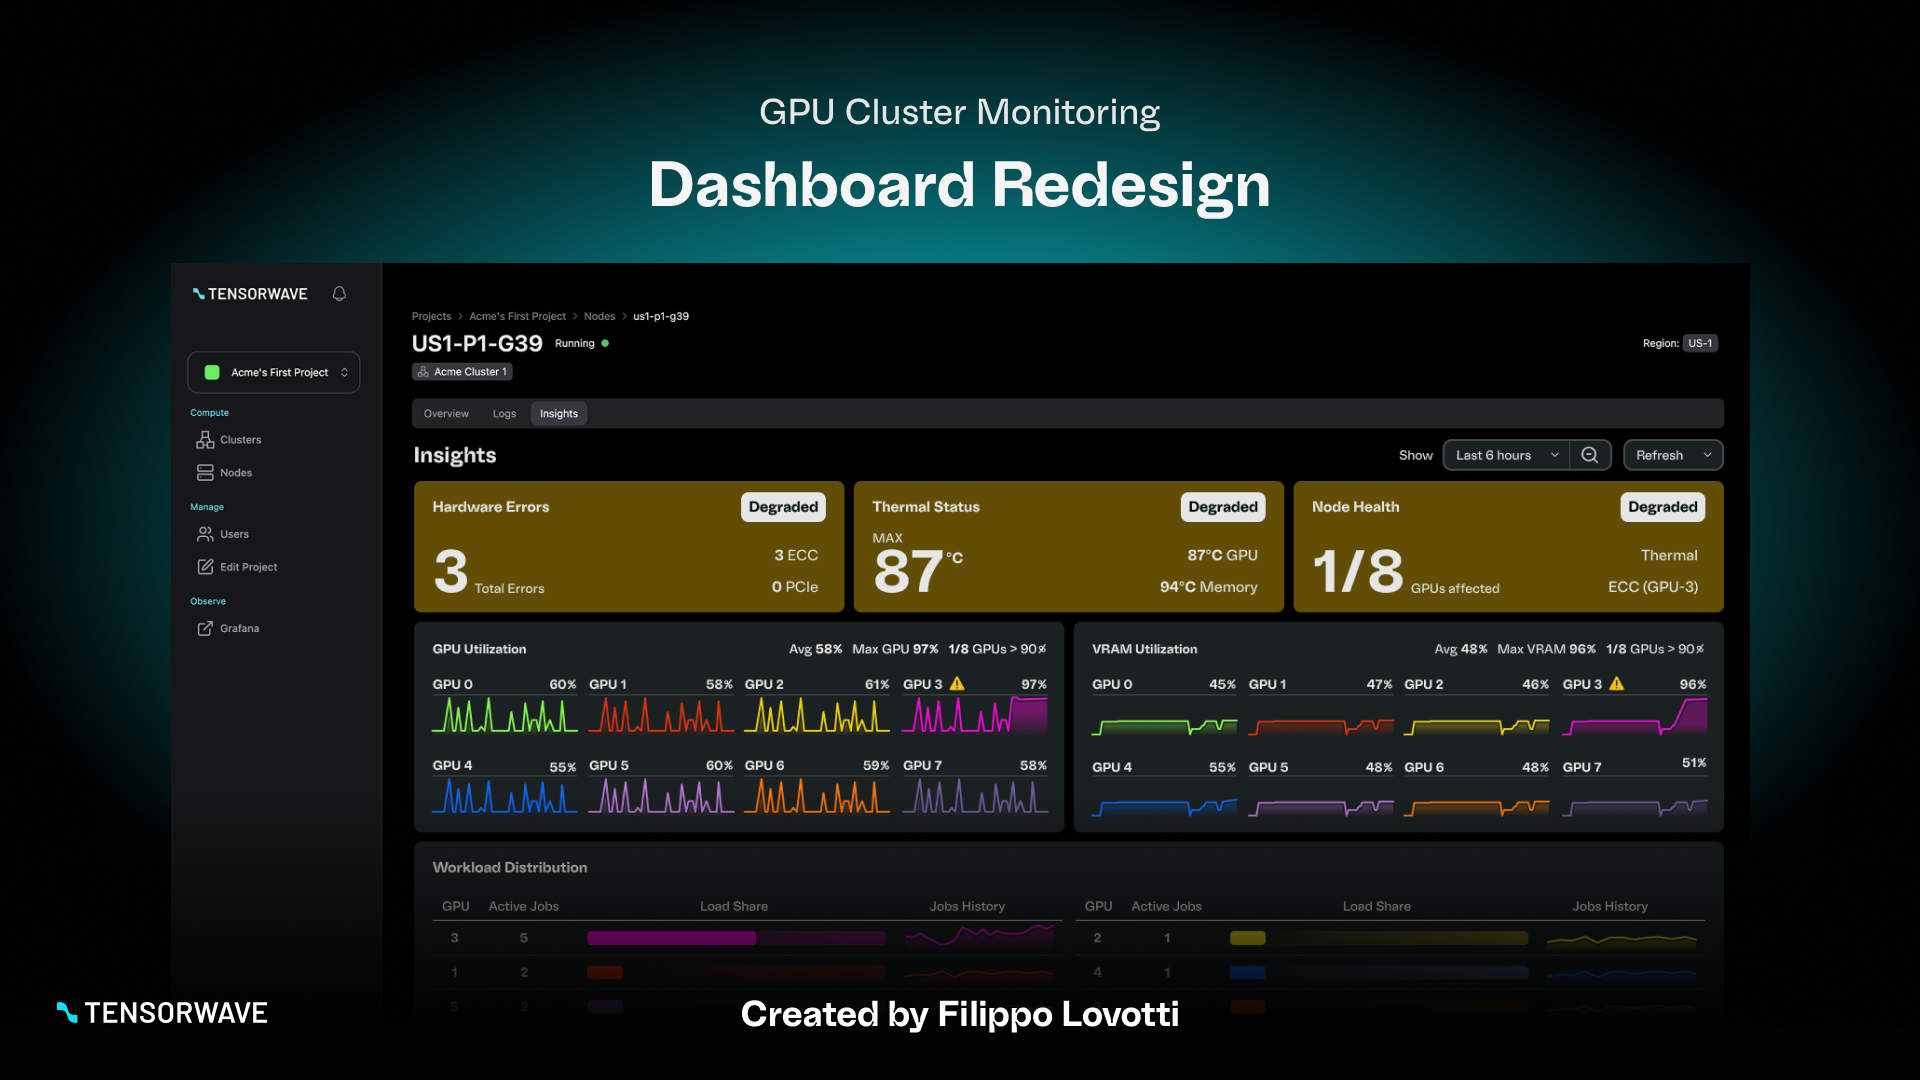
2) Visualization choices

I selected visualization types based on how the data is used:

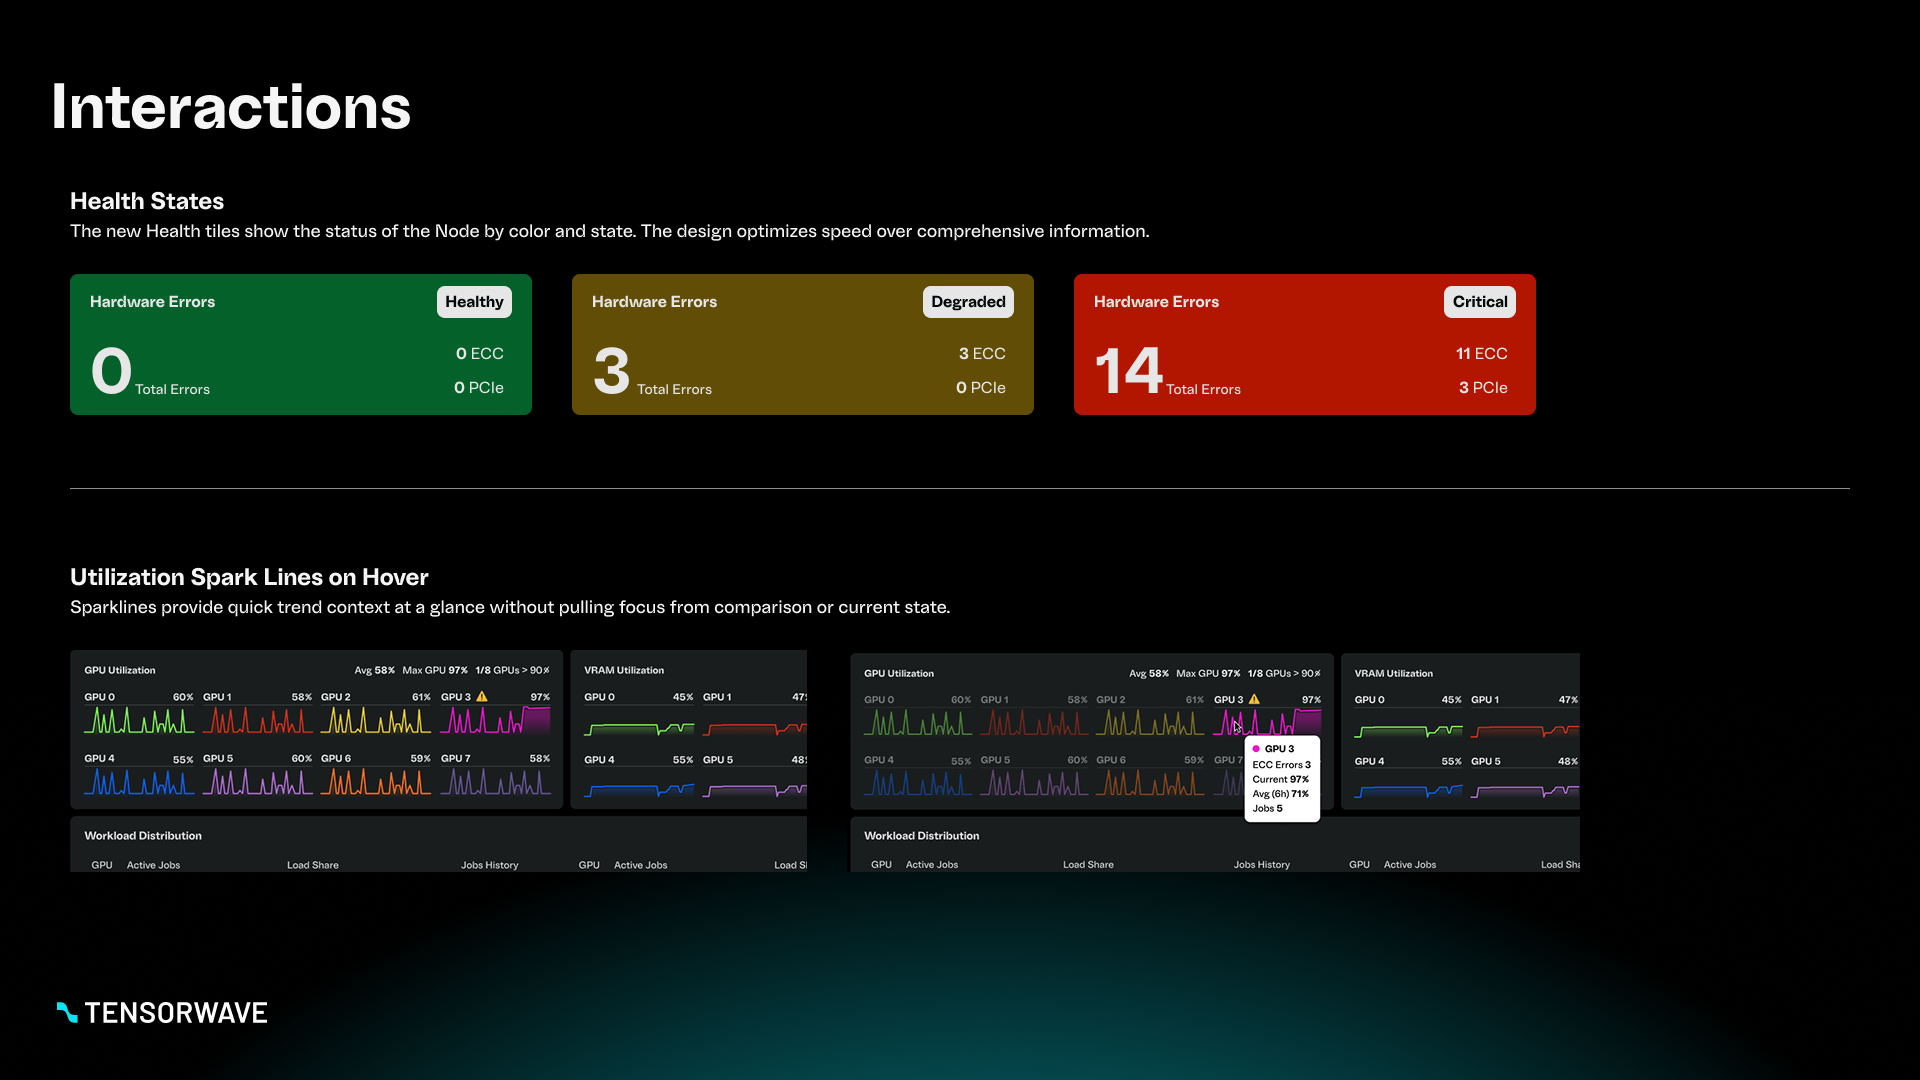
  • High-level status tiles for rapid health scanning
  • Compact trend visuals for comparing utilization across GPUs at a glance
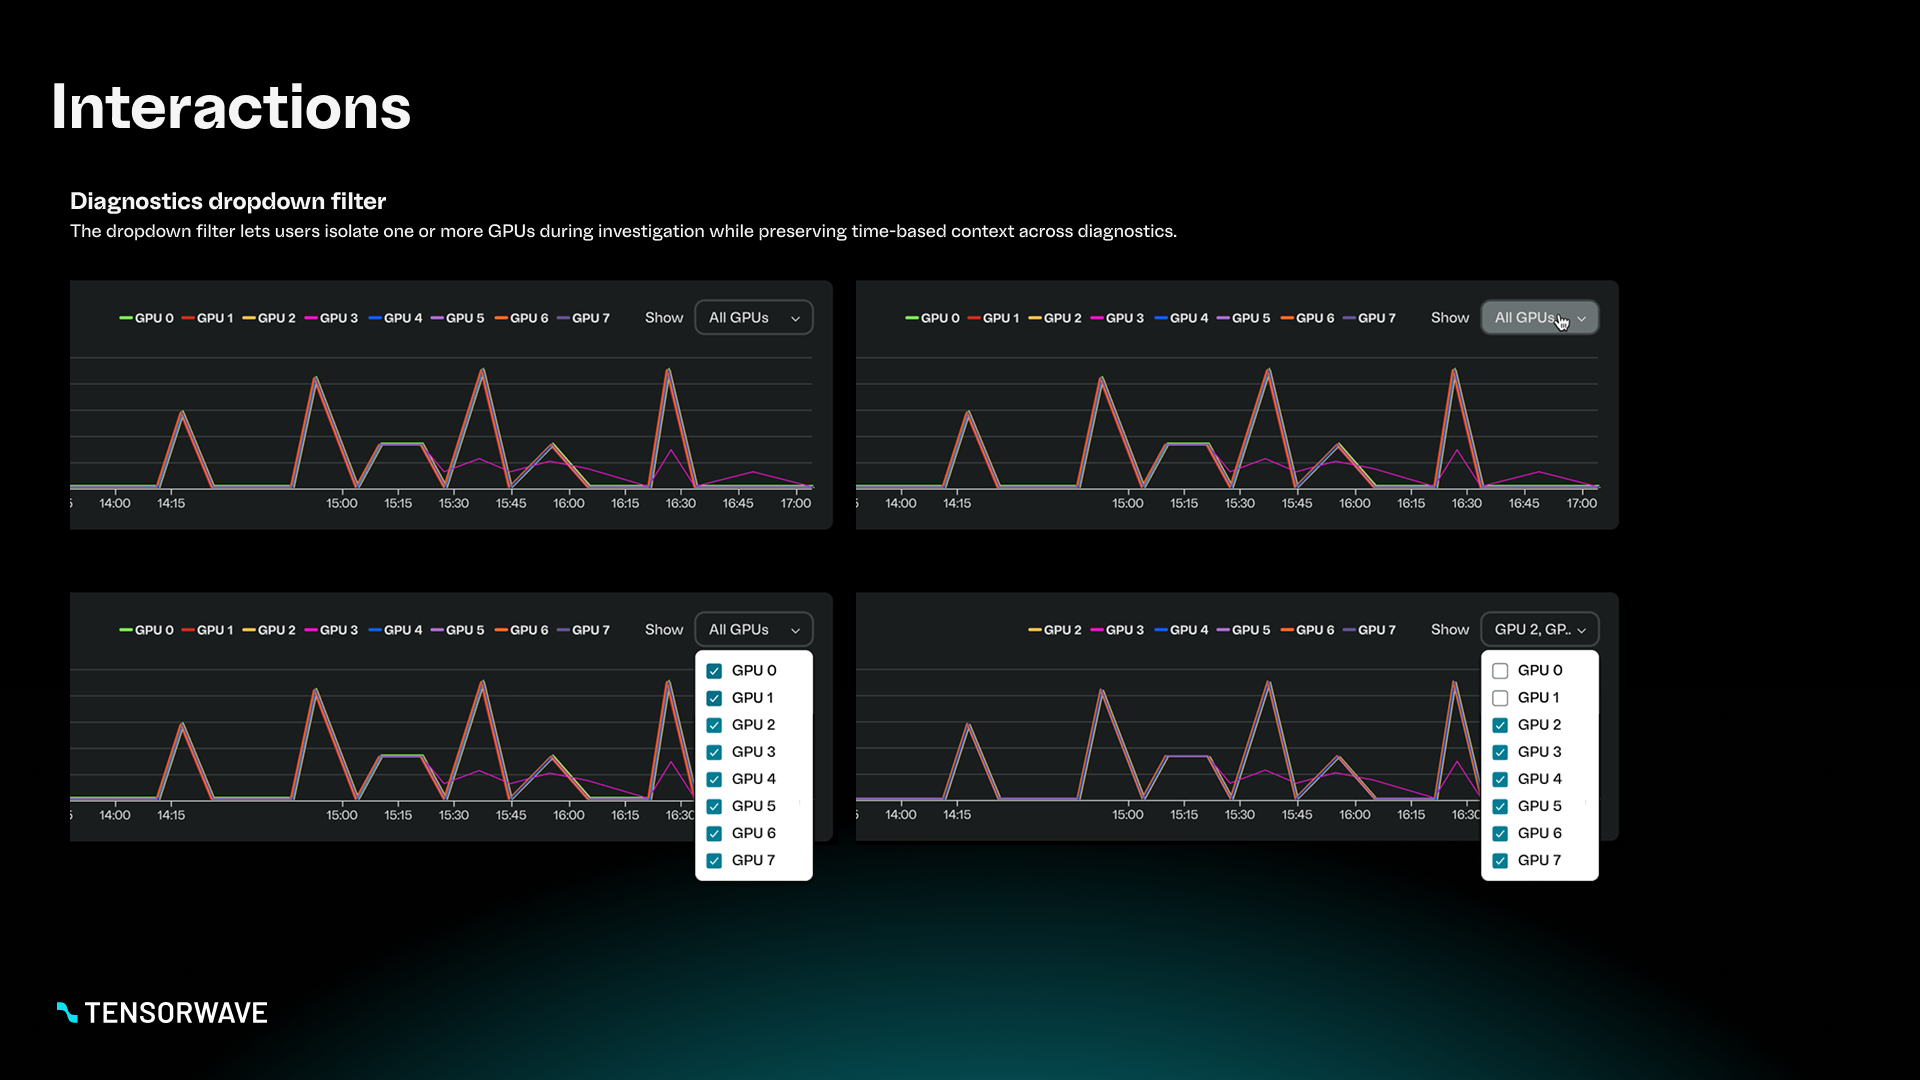
  • Time-series diagnostics charts to support investigation and pattern recognition

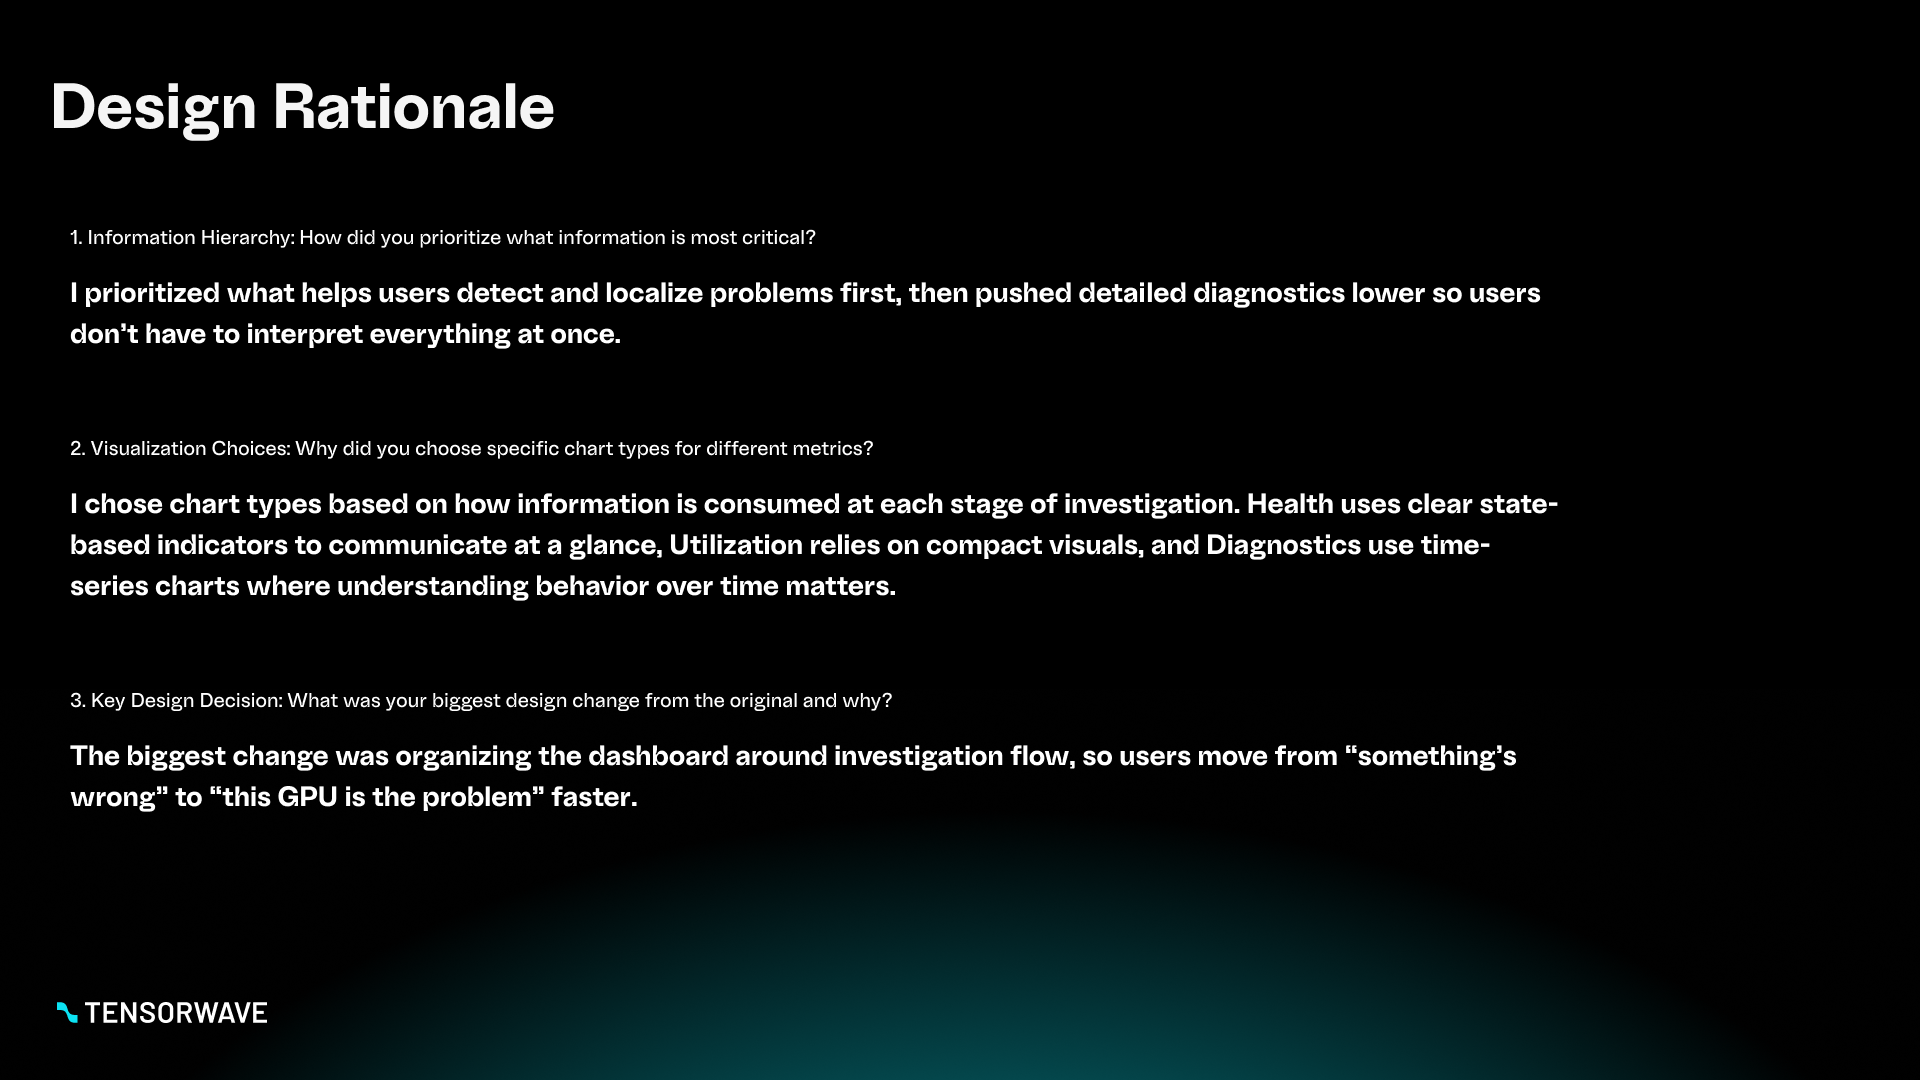
3) Key design decision

My biggest change was shifting from a flat, metric-first layout to a question-first layout that supports operational workflows: detect → assess → investigate.

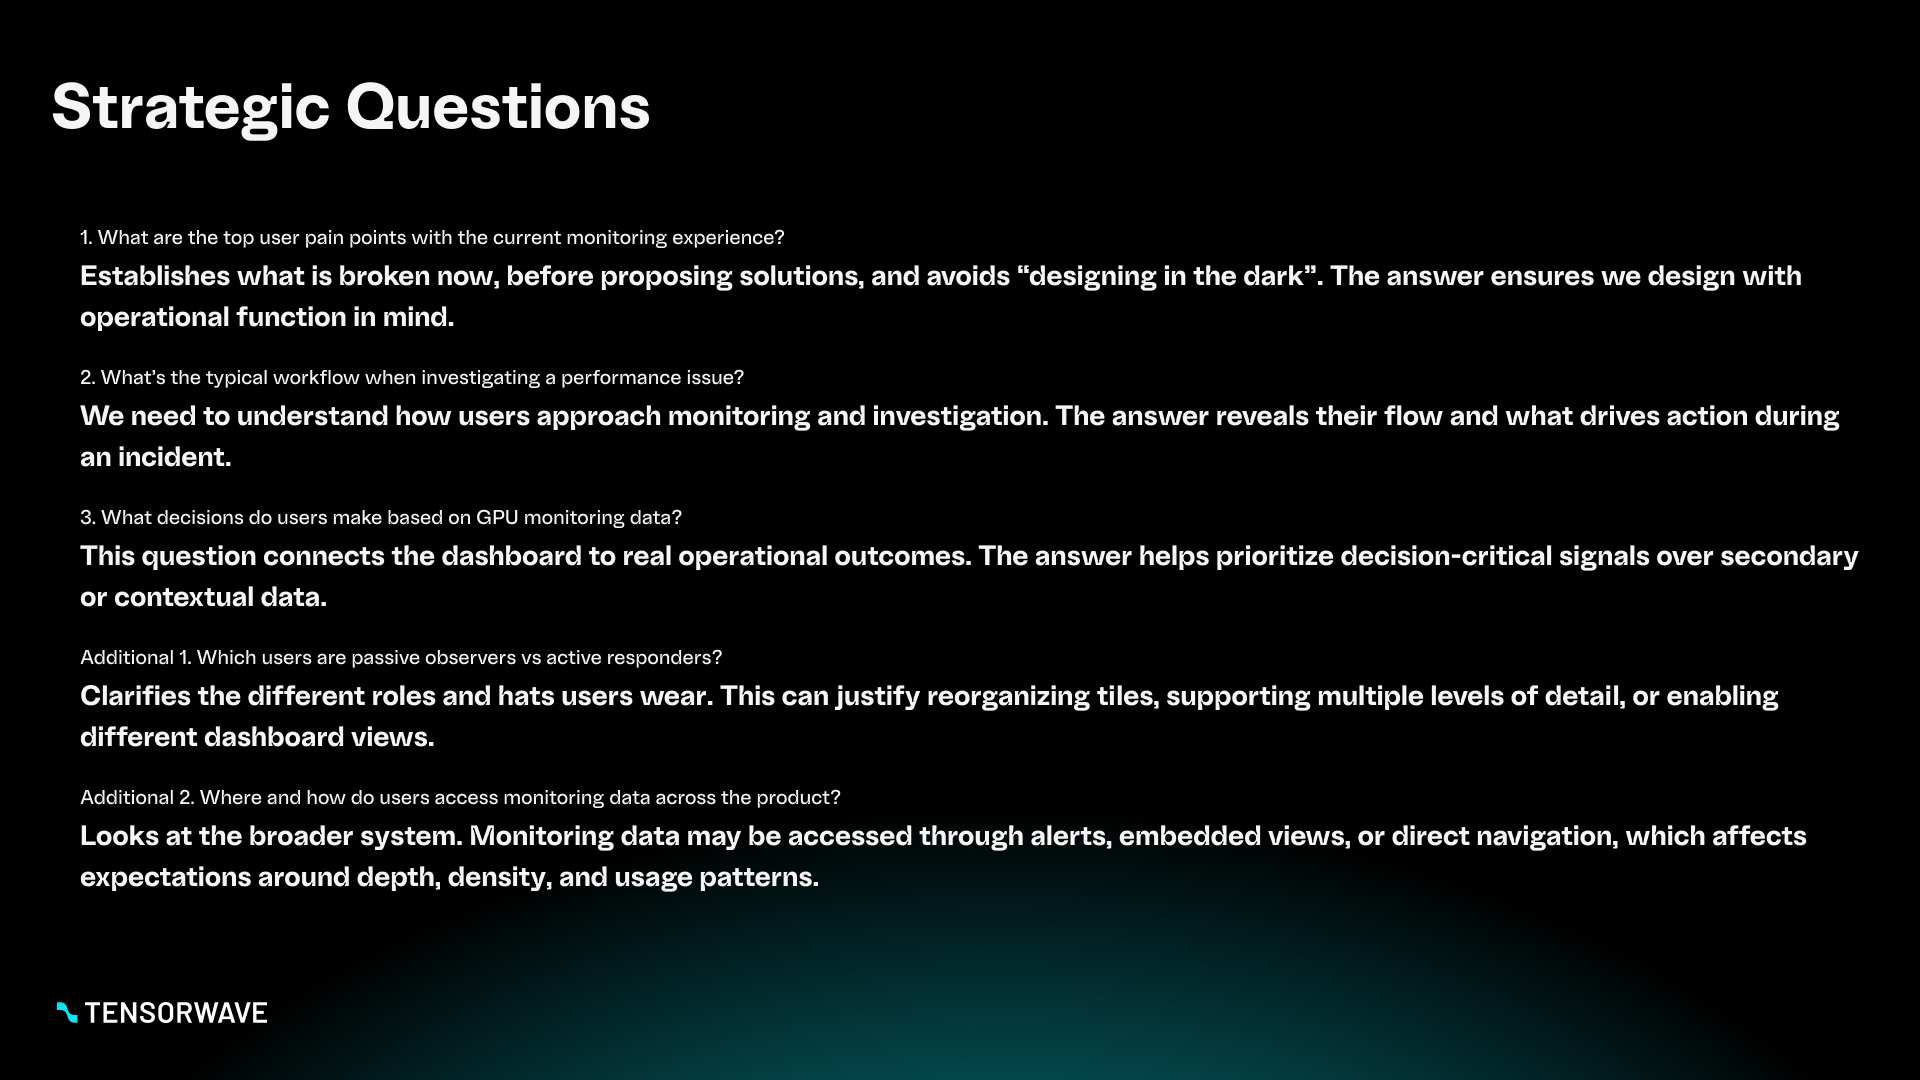
See my thinking process in the Figjam below.

Key Improvements

Health at a glance

I introduced a top-level health section designed for fast scanning. It surfaces the most actionable signals first, such as thermal and error states, without requiring users to interpret multiple charts to understand whether something is wrong.

Utilization for quick comparison

Utilization metrics were designed to support quick comparisons across GPUs, helping users spot imbalance, contention, or runaway behavior.

Diagnostics with lightweight filtering

I added a simple filtering mechanism to isolate GPU-level diagnostics while preserving time context, enabling faster investigation without hiding surrounding signals.

See the full deck below.

Download the Deck

Do you want to see the full deliverable at your own pace?